Difference between revisions of "106.3.2.59 TM-59, Determination of the International Roughness Index"
m (106.3.2.59 TM-59, Determination of the Profilograph Index moved to 106.3.2.59 TM-59, Determination of the International Roughness Index: Per CM, re-wrote TM-59 to comply with new Sec 610.) |
m (→106.3.2.59.3 Construction Acceptance Procedures: Per CM, minor clarifications) |
||
| (8 intermediate revisions by the same user not shown) | |||
| Line 1: | Line 1: | ||
| − | This method | + | This method describes the procedure for determining the International roughness index (IRI) of pavement surfaces in English units. |
| − | ==106.3.2.59.1 | + | ==106.3.2.59.1 Equipment== |
| − | |||
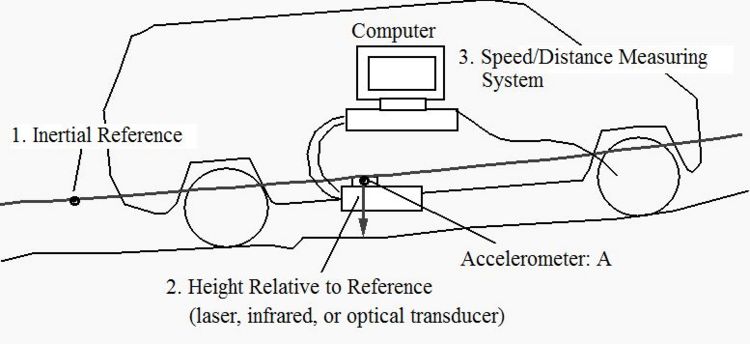
| − | + | '''Inertial Profiler.''' The International roughness index (IRI) shall be measured with an inertial profiler (IP). The IP shall meet the equipment requirements of AASHTO M 328, which include the following three primary transducers: (1) a height sensor that measures the distance between the pavement and a vehicle reference point, (2) an accelerometer that measures the vehicle vertical acceleration in response to the pavement profile and (3) a distance sensor that provides a location reference as the vehicle moves longitudinally (see Fig. 106.3.2.59.1). The IP shall also be equipped with an automated triggering system that can automatically start and stop data collection using a reference mark. The IP shall store the profile elevation data at an interval of 2 in. or less and have a vertical measurement resolution of 0.001 in. or less. The IP equipment may be either the low speed or high speed type. The IP shall be capable of exporting unfiltered raw profile data to an electronic file (conforming to ASTM E 2560) that can be imported into the ProVAL software program. | |
| − | 1 | + | [[image:106.3.2.59.1.jpg|center|750px|thumb|<center>'''Fig. 106.3.2.59.1'''</center>]] |
| + | |||
| − | + | '''ProVAL.''' The profile file shall be evaluated using the ProVAL software program. ProVAL is a free program developed by The Transtec Group under contract with the FHWA. The current program version is [http://www.roadprofile.com/ ProVAL 3.4] and can be downloaded. | |
| − | 3 | + | ==106.3.2.59.2 Inertial Profiler Certification Procedures== |
| − | |||
| − | + | Each IP used for construction acceptance testing on a MoDOT project shall be annually certified (verified) at the Linn State Technical Colleg test site. The test site will have a known IRI in two wheel paths, measured with a reference profiler. | |
| − | + | The inertial profiler (IP) shall have its low- and high-pass filters set to zero prior to the certification test. The IP shall have any other controls set according to manufacturer’s specifications. The two sensors in the profiler shall be spaced 6 ft. apart. | |
| − | + | The IP operator may perform trial profile runs prior to the certification testing. The IP shall start far enough in advance of the test section to reach data collection speed. The IP operator shall perform five profile runs on the test section collecting data in both wheel paths. The IP shall move at a constant speed over the test section. An IP with two sensors shall measure both wheel path profiles in a single pass. An IP with one sensor shall measure each wheel path profile individually. Upon completion of testing, the IP operator shall provide the certification engineer the unfiltered profiles in .ppf file format on a readable electronic storage device such as a flash drive. Each file shall be labeled in the following format: | |
| − | |||
| − | + | :Contractor_IP Manufacturer_IP Type_Unique Equipment ID #_Wheel Path Tested_Test Run #.ppf | |
| + | :For "IP Type" enter "HS" for high speed and "LS"’ for low speed. | ||
| + | :For "Wheel Path Tested" enter "L" for left, "R" for right and "B" for both. | ||
| + | :For "Test Run #"’ enter 1,2,3,4 or 5. | ||
| + | :Ex. CBI_Ames_HS_600406_B_2.ppf. | ||
| − | + | MoDOT will analyze the submitted data using ProVAL. Based on AASHTO R 56-10, the test results of the inertial profiler (IP) shall meet the following requirements: | |
| − | :: | + | :* Minimum average cross-correlation repeatability shall be 92%. |
| + | :* Minimum average cross-correlation accuracy shall be 90%. | ||
| − | + | A ProVAL certification report shall be generated for each inertial profiler (IP) that receives acceptable test results at the certification. The report shall be digitally signed with the State Construction and Materials Engineer signature and shall be electronically stored on the MoDOT V:-drive and sent to the contractor or testing consultant. Inertial profilers that do not pass the certification test shall be corrected offsite by their respective owners and recertified at a later date. | |
| − | |||
| − | + | ==106.3.2.59.3 Construction Acceptance Procedures== | |
| − | |||
| − | |||
| − | + | '''Testing Conditions.''' All objects and foreign material shall be removed from the pavement surface. There shall be no standing water in the wheel paths during testing. Inertial profiler high- and low-pass filters shall be set at zero. | |
| − | |||
| − | + | '''Testing Limits.''' The inertial profiler shall measure the surface of a pavement section in both wheel paths, that are located 3 ft. from and parallel to the edges of the lane, running in the direction of travel. | |
| − | : | + | :* The starting point shall be 50 ft. before the start of the day’s paving. |
| + | :* The starting point shall be a known station or logmile measured to the nearest foot. | ||
| + | :* The IP shall use an automated triggering mechanism to initiate data collection at the starting point and end data collection at the ending point. | ||
| + | :* The starting point shall be visibly marked for the duration of the project so that subsequent profile measurements may be closely matched. | ||
| + | <div id="Data Submittal."></div> | ||
| − | + | '''Data Submittal.''' The contractor shall submit an electronic file in .ppf format containing the unfiltered raw data collected at the project. <u>Data shall be submitted within 24 hours of testing.</u> The file may consist of more than one section. Inertail profiler files with QC data results shall be submitted to MoDOT using the naming convention in Table 106.3.2.59.3. | |
| − | |||
| − | + | <center>'''Table 106.3.2.59.3, Categories of Warning Signs and Plaques''' | |
| − | + | {| border="1" class="wikitable" style="margin: 1em auto 1em auto" style="text-align:center" | |
| − | |||
| − | |||
| − | |||
| − | |||
| − | |||
| − | |||
| − | |||
| − | |||
| − | |||
| − | |||
| − | |||
| − | {| border="1" class="wikitable" style="margin: 1em auto 1em auto" | ||
|+ | |+ | ||
| − | + | ! style="background:#BEBEBE" colspan="2"|Electronic Profilograph File Naming Convention* | |
|- | |- | ||
| − | | | + | |Abbreviation|| Definition |
|- | |- | ||
| − | | || | + | |YYMMDD-###_ ||Contract ID (Letting Date-Call Number) |
|- | |- | ||
| − | | | + | |YYMMDD_ ||Test Date |
|- | |- | ||
| − | | | + | |Q_ ||Type of quality test (C for control, A for assurance) |
|- | |- | ||
| − | | | + | |D ||Direction of Lane (N,E,W or S) |
| + | |- | ||
| + | |L ||Lane number (1 for inside lane, increasing by one for each lane to the right) | ||
| + | |- | ||
| + | |W ||Wheel path (L, R, or B) | ||
| + | |- | ||
| + | |S ||Beginning Station (rounded to nearest foot) | ||
| + | |- | ||
| + | |colspan="2" align="left"|* Example: 100528-501_111103_C_N2R105045.PPF | ||
|} | |} | ||
| + | </center> | ||
| + | |||
| + | '''Data Analysis.''' The engineer shall use the ProVAL program to analyze the QC file. ProVAL shall also be used for quality assurance (QA) test data. The analysis will consist of two primary components: 1) ''segment smoothness'' evaluated with the "Ride Quality" module and 2) ''areas of localized roughness'' (ALR) evaluated with the "Smoothness Assurance" module. | ||
| + | |||
| + | ===106.3.2.59.3.1 Segment Smoothness=== | ||
| + | The data will first be analyzed for ride quality, which will determine the average IRI for each wheel track on a per segment basis. The steps are as follow: | ||
| + | |||
| + | :* '''Open ProVAL program.''' | ||
| + | |||
| + | :* '''Select "New".''' | ||
| + | |||
| + | [[image:106.3.2.59.3 new 2014.jpg|center|750px]] | ||
| + | |||
| + | |||
| + | :* '''Select "Add Files" to import PPF file with QC/QA profile data. ''' | ||
| + | |||
| + | File(s) will contain either right and left track profiles or single wheel track profiles. | ||
| + | |||
| + | [[image:106.3.2.59.3 add files 2014.jpg|center|750px]] | ||
| + | |||
| + | |||
| + | :* '''Select left elevation and right elevation. ''' | ||
| + | |||
| + | The following example uses a file containing both wheel paths. The program will correctly align files with individual wheel paths, provided the data collection was initiated at the same starting station for both files. The next screen shot shows the actual change in elevation along the profile length. | ||
| + | |||
| + | [[image:106.3.2.59.3 left right 2014.jpg|center|750px]] | ||
| + | |||
| + | |||
| + | :* '''Select "Ride Quality" in the "Analysis" module.''' | ||
| + | |||
| + | [[image:106.3.2.59.3 ride 2014.jpg|center|750px]] | ||
| + | |||
| + | :* '''Select "Fixed Interval" in the "Analysis Type" dropdown box.''' | ||
| + | |||
| + | :* '''Change "Threshold" limit to 80 (in/mi). (''Note:'' this threshold applies to pavement with posted speeds over 45 mph. The threshold is 125 (in/mi) for lower speed routes.) The "Segment Length" should show the default value of 528 ft. and the "Ride Quality Index" should show the default name of "IRI".''' | ||
| + | |||
| + | :* '''Check box for "LElev." and "RElev." and make sure the "Apply 250mm Filter" box is checked for both.''' | ||
| + | |||
| + | [[image:106.3.2.59.3 LElev 2014.jpg|center|750px]] | ||
| + | |||
| + | |||
| + | :* '''Select "Analyze". ''' | ||
| + | |||
| + | [[image:106.3.2.59.3 analyze 2014.jpg|center|750px]] | ||
| + | |||
| + | The average IRI of a wheel path for each 528 ft. long segment will be shown on the screen. The drop down menu above table at left can be used to view either left or right wheel path IRI values | ||
| + | |||
| + | [[image:106.3.2.59.3 average IRI.jpg|center|750px]] | ||
| + | |||
| + | :* '''Select "Excel" in the "Report" dropdown box.''' | ||
| + | |||
| + | [[image:106.3.2.59.3 Excel.jpg|center|750px]] | ||
| + | |||
| + | :* Open the Excel file. | ||
| + | |||
| + | Average IRI for each segment for both wheel paths is listed in the Excel spreadsheet. | ||
| + | |||
| + | [[image:106.3.2.59.3 spreadsheet.jpg|center|750px]] | ||
| + | |||
| + | :* Copy and paste this data into the "IRI Inertial Profiler Report with Bonus" Excel spreadsheet in the V:\Smoothness folder. Select the appropriate individual worksheet in the "Start" worksheet (first tab); based on posted route speed, pavement type and pay unit type. The worksheet will automatically generate pay factors for each segment. | ||
| + | |||
| + | [[image:106.3.2.59.3 IRI summary 2014.jpg|center|900px]] | ||
| + | |||
| + | There may be exempted areas per [http://www.modot.org/business/standards_and_specs/SpecbookEPG.pdf#page=9 Sec 601.4.2.2] within the section profile limits. The engineer should verify that the limits do not go beyond the eligible exemption area. The contractor may elect to: | ||
| + | |||
| + | :1) Stop the profile run at the beginning of the exemption and begin a new section profile at the end of the exemption. | ||
| + | :2) Manually enter exemption boundaries in the data acquisition software during the profile run (typically performed with high speed IPs). | ||
| + | :3) Enter a "leave-out" area in ProVAL during the ride quality analysis. The instructions for performing this are as follows: | ||
| + | |||
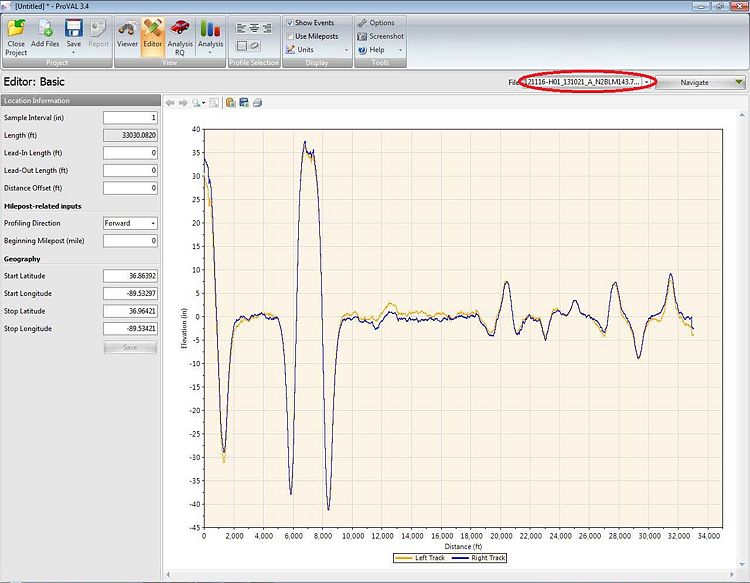
| + | :* '''Select "Editor". Select the file from the File dropdown menu.''' | ||
| + | |||
| + | [[image:106.3.2.59.3 editor.jpg|center|750px]] | ||
| + | |||
| + | :* Select the IP file from the "File" dropdown box. | ||
| + | |||
| + | [[image:106.3.2.59.3 IP file.jpg|center|750px]] | ||
| + | |||
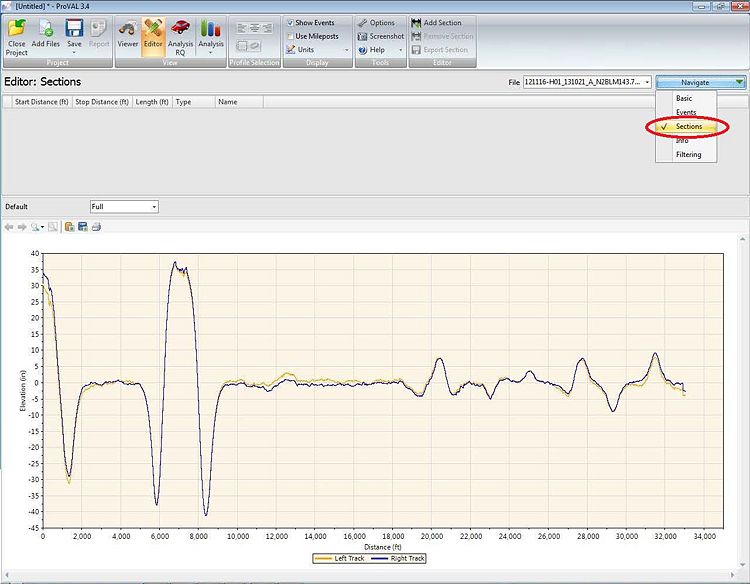
| + | :* Select "Sections in the "Navigate" dropdown box. | ||
| + | |||
| + | [[image:106.3.2.59.3 navigate 2014.jpg|center|750px]] | ||
| + | |||
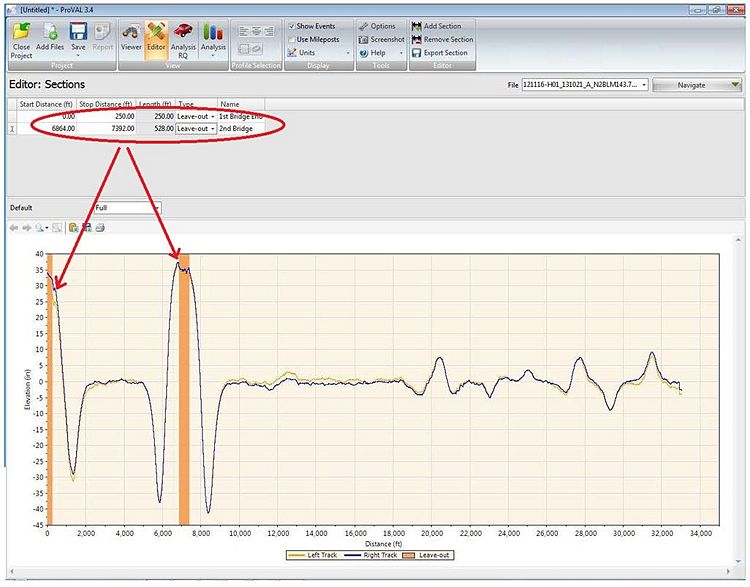
| + | :* '''Select "Add Section".''' | ||
| + | |||
| + | :* '''Enter section(s) Start Distance, Stop Distance, Type (Leave-out) and Name.''' | ||
| + | |||
| + | For this example, assume there are two leave-out areas: one at the beginning where a bridge approach on the upstream side is within limits and another over a mile farther where there is another bridge. | ||
| + | |||
| + | [[image:106.3.2.59.3 leave out areas.jpg|center|750px]] | ||
| + | |||
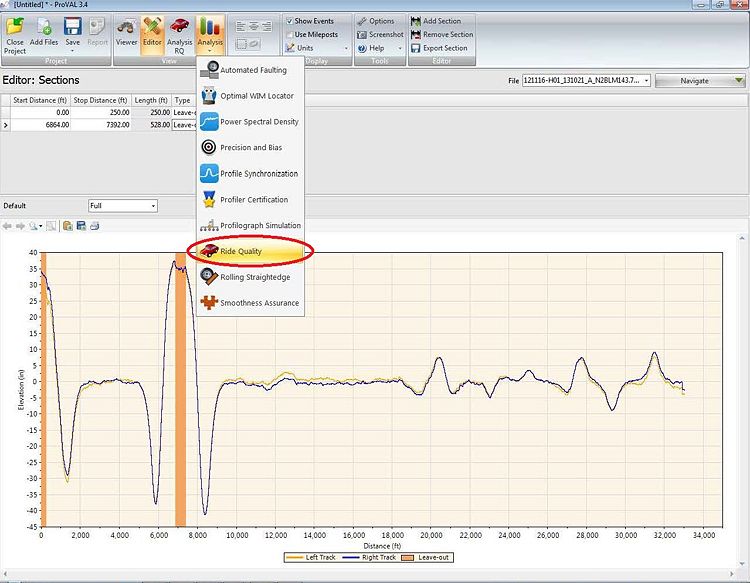
| + | :* '''Select "Analysis" and select "Ride Quality".''' | ||
| + | |||
| + | [[image:106.3.2.59.3 ride quality 2014.jpg|center|750px]] | ||
| + | |||
| + | The ride quality summary shown below now excludes the exempted areas of the profile and abbreviates the associated segments accordingly. | ||
| + | |||
| + | [[image:106.3.2.59.3 associated segments 2014.jpg|center|750px]] | ||
| + | |||
| + | :* Select "Excel" in "Report" dropdown box. | ||
| + | |||
| + | :* Open the Excel report. | ||
| + | |||
| + | Since the first leave-out was at the beginning of the project, ProVAL has shifted the boundaries of the original segments to maintain 528-ft. lengths. However, it truncates the segment preceding the second bridge, so that it can again begin with 528-ft. lengths on the other side of the bridge. This means leave-outs should be established and analyzed in ProVAL prior to exporting the results to the "IRI Inertial Profiler Report with Bonus" Excel spreadsheet in the V:\Smoothness folder. | ||
| + | |||
| + | [[image:106.3.2.59.3 bonus.jpg|center|750px]] | ||
| + | |||
| + | ====106.3.2.59.3.1.1 Inserting Leave-Outs==== | ||
| + | |||
| + | Prior to analyzing ride quality some reformatting of the stationing will probably be necessary. In this example, assume the beginning of the inertial profiler run is at log mile 132.2. | ||
| + | |||
| + | :* Select "Navigate" dropdown box | ||
| + | :* Select "Basic" | ||
| + | :* Enter 132.2 in "Beginning Milepost (mile)" box | ||
| + | :* Select "Save" | ||
| + | |||
| + | ProVAL has now reformatted the stations to represent actual project limits for the profile section. | ||
| + | |||
| + | [[image:106.3.2.59.3.1.1.jpg|center|750px]] | ||
| + | |||
| + | ====106.3.2.59.3.1.2 Reversing Stations==== | ||
| + | |||
| + | Another situation that may arise is when the direction of travel is in a station descending direction. ProVAL can also easily make this adjustment in the "Editor" mode. For this example, the starting log mile 132.2 will be retained. | ||
| + | |||
| + | :* Select "Profiling Direction" dropdown box | ||
| + | :* Select "Reverse" | ||
| + | :* Select "Save" | ||
| + | |||
| + | [[image:106.3.2.59.3.1.2 reverse.jpg|center|750px]] | ||
| + | |||
| + | Rerunning the ride analysis and creating the Excel report file will provide segment data in the reverse direction. | ||
| + | |||
| + | :* Select "Analysis" and select "Ride Quality". | ||
| + | :* Select "Excel" in "Report" dropdown box. | ||
| + | :* Open the Excel report. | ||
| + | |||
| + | [[image:106.3.2.59.3.1.2 report.jpg|center|750px]] | ||
| + | |||
| + | ===106.3.2.59.3.2 Areas of Localized Roughness=== | ||
| + | |||
| + | :* '''Select "Smoothness Assurance" in "Analysis" dropdown box.''' | ||
| + | |||
| + | [[image:106.3.2.59.3.2 smoothness 2014.jpg|center|750px]] | ||
| + | |||
| + | |||
| + | :* '''Change "Threshold" value for "Short Continuous" analysis to 125 (in/mi) in the "Ride Quality" section. (The segment length for "Short Continuous" should be set at the default value of 25 ft.). Change "Threshold" for "Long Continuous" and "Fixed Interval" in the "Profile" section to 80 (in/mi). (The "Segment Length" for both "Long Continuous" and "Fixed Interval" should be set at the default value of 528 feet.) ''' | ||
| + | |||
| + | :* '''Check "Right Elevation" only in the "Profile" section (ensure "Apply 250mm Filter" is also checked).''' | ||
| + | |||
| + | :* '''Select "Analyze".''' | ||
| + | |||
| + | [[image:106.3.2.59.3.2 analyze 2014.jpg|center|750px]] | ||
| + | |||
| + | |||
| + | :* '''Select "Grinding" in the "Navigate" dropdown box.''' | ||
| + | |||
| + | [[image:106.3.2.59.3.2 navigate 2014.jpg|center|760px]] | ||
| + | |||
| + | |||
| + | :* '''Enter 0.25 inches for "Maximum Grinding Depth" in "Grinder" section. (The following parameters should show the default values, which are Head Position = 0.50, Wheelbase (ft) = 18.00, Tandem Spread (ft) = 2.49 and Short Cut-Off Wavelength (ft) = 0.820 ft.)''' | ||
| + | |||
| + | :* '''Select "Auto Grind".''' | ||
| + | |||
| + | [[image:106.3.2.59.3.2 auto grind 2014.jpg|center|760px]] | ||
| − | |||
| − | : | + | :* '''Select "Grind".''' |
| − | |||
| − | + | [[image:106.3.2.59.3.2 grind 2014.jpg|center|750px]] | |
| − | |||
| − | |||
| − | |||
| − | + | :* '''Select "Short Continuous" in "Navigate" dropdown box.''' | |
| − | [[image:106. | + | [[image:106.3.2.59.3.2 short continuous 2014.jpg|center|760px]] |
| + | |||
| + | :* '''Select "PDF" in "Report" dropdown box.''' | ||
| − | + | [[image:106.3.2.59.3.2 report 2014.jpg|center|750px]] | |
| − | |||
| − | |||
| − | |||
| − | + | The grinding report is generated showing locations of areas of localized roughness (ALR). The grinding simulation numerically indicates what the expected improvement in smoothness should be when the ALRs are diamond ground. This information serves as a guide for both the contractor and the engineer for determining which ALRs can be corrected with conventional grinding and which may require other corrective measures. | |
| − | + | [[image:106.3.2.59.3.2 comparisons 2014.jpg|center|750px]] | |
| − | + | ||
| + | |||
| + | Comparisons for IRI before and after grinding are shown in tabular and bar graph form. | ||
| − | ==106.3.2.59.4 | + | ==106.3.2.59.4 Dispute Resolution== |
| − | + | [[image:106.3.2.59.4.jpg|right|170px|thumb|<center>'''MoDOT Reference Profiler '''</center>]] | |
| + | In the event that the QC/QA results are not within tolerance (after the absolute value of the difference between the contractor and engineer IRIs are computed for each segment within the QA test length, the average of the absolute values of the IRI difference shall be 8 in./mile or less and the absolute value of the IRI difference for any single segment shall be 12 in./mile or less), the MoDOT SurPro reference profiler shall arbitrate the dispute. The engineer shall randomly select a 528 ft. area within the disputed pavement length and run the MoDOT reference profiler in the left and right wheel paths. The arbitration profile shall be correlated with its corresponding QC and QA profiles in ProVAL. Whichever of the average QC/QA IRI profiles is closer to the arbitration IRI profile shall be the binding profile for the purpose of construction acceptance. | ||
[[Category:106.3.2 Material Inspection Test Methods]] | [[Category:106.3.2 Material Inspection Test Methods]] | ||
Revision as of 12:37, 2 September 2020
This method describes the procedure for determining the International roughness index (IRI) of pavement surfaces in English units.
Contents
106.3.2.59.1 Equipment
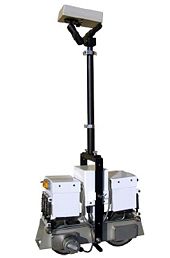
Inertial Profiler. The International roughness index (IRI) shall be measured with an inertial profiler (IP). The IP shall meet the equipment requirements of AASHTO M 328, which include the following three primary transducers: (1) a height sensor that measures the distance between the pavement and a vehicle reference point, (2) an accelerometer that measures the vehicle vertical acceleration in response to the pavement profile and (3) a distance sensor that provides a location reference as the vehicle moves longitudinally (see Fig. 106.3.2.59.1). The IP shall also be equipped with an automated triggering system that can automatically start and stop data collection using a reference mark. The IP shall store the profile elevation data at an interval of 2 in. or less and have a vertical measurement resolution of 0.001 in. or less. The IP equipment may be either the low speed or high speed type. The IP shall be capable of exporting unfiltered raw profile data to an electronic file (conforming to ASTM E 2560) that can be imported into the ProVAL software program.
ProVAL. The profile file shall be evaluated using the ProVAL software program. ProVAL is a free program developed by The Transtec Group under contract with the FHWA. The current program version is ProVAL 3.4 and can be downloaded.
106.3.2.59.2 Inertial Profiler Certification Procedures
Each IP used for construction acceptance testing on a MoDOT project shall be annually certified (verified) at the Linn State Technical Colleg test site. The test site will have a known IRI in two wheel paths, measured with a reference profiler.
The inertial profiler (IP) shall have its low- and high-pass filters set to zero prior to the certification test. The IP shall have any other controls set according to manufacturer’s specifications. The two sensors in the profiler shall be spaced 6 ft. apart.
The IP operator may perform trial profile runs prior to the certification testing. The IP shall start far enough in advance of the test section to reach data collection speed. The IP operator shall perform five profile runs on the test section collecting data in both wheel paths. The IP shall move at a constant speed over the test section. An IP with two sensors shall measure both wheel path profiles in a single pass. An IP with one sensor shall measure each wheel path profile individually. Upon completion of testing, the IP operator shall provide the certification engineer the unfiltered profiles in .ppf file format on a readable electronic storage device such as a flash drive. Each file shall be labeled in the following format:
- Contractor_IP Manufacturer_IP Type_Unique Equipment ID #_Wheel Path Tested_Test Run #.ppf
- For "IP Type" enter "HS" for high speed and "LS"’ for low speed.
- For "Wheel Path Tested" enter "L" for left, "R" for right and "B" for both.
- For "Test Run #"’ enter 1,2,3,4 or 5.
- Ex. CBI_Ames_HS_600406_B_2.ppf.
MoDOT will analyze the submitted data using ProVAL. Based on AASHTO R 56-10, the test results of the inertial profiler (IP) shall meet the following requirements:
- Minimum average cross-correlation repeatability shall be 92%.
- Minimum average cross-correlation accuracy shall be 90%.
A ProVAL certification report shall be generated for each inertial profiler (IP) that receives acceptable test results at the certification. The report shall be digitally signed with the State Construction and Materials Engineer signature and shall be electronically stored on the MoDOT V:-drive and sent to the contractor or testing consultant. Inertial profilers that do not pass the certification test shall be corrected offsite by their respective owners and recertified at a later date.
106.3.2.59.3 Construction Acceptance Procedures
Testing Conditions. All objects and foreign material shall be removed from the pavement surface. There shall be no standing water in the wheel paths during testing. Inertial profiler high- and low-pass filters shall be set at zero.
Testing Limits. The inertial profiler shall measure the surface of a pavement section in both wheel paths, that are located 3 ft. from and parallel to the edges of the lane, running in the direction of travel.
- The starting point shall be 50 ft. before the start of the day’s paving.
- The starting point shall be a known station or logmile measured to the nearest foot.
- The IP shall use an automated triggering mechanism to initiate data collection at the starting point and end data collection at the ending point.
- The starting point shall be visibly marked for the duration of the project so that subsequent profile measurements may be closely matched.
Data Submittal. The contractor shall submit an electronic file in .ppf format containing the unfiltered raw data collected at the project. Data shall be submitted within 24 hours of testing. The file may consist of more than one section. Inertail profiler files with QC data results shall be submitted to MoDOT using the naming convention in Table 106.3.2.59.3.
| Electronic Profilograph File Naming Convention* | |
|---|---|
| Abbreviation | Definition |
| YYMMDD-###_ | Contract ID (Letting Date-Call Number) |
| YYMMDD_ | Test Date |
| Q_ | Type of quality test (C for control, A for assurance) |
| D | Direction of Lane (N,E,W or S) |
| L | Lane number (1 for inside lane, increasing by one for each lane to the right) |
| W | Wheel path (L, R, or B) |
| S | Beginning Station (rounded to nearest foot) |
| * Example: 100528-501_111103_C_N2R105045.PPF | |
Data Analysis. The engineer shall use the ProVAL program to analyze the QC file. ProVAL shall also be used for quality assurance (QA) test data. The analysis will consist of two primary components: 1) segment smoothness evaluated with the "Ride Quality" module and 2) areas of localized roughness (ALR) evaluated with the "Smoothness Assurance" module.
106.3.2.59.3.1 Segment Smoothness
The data will first be analyzed for ride quality, which will determine the average IRI for each wheel track on a per segment basis. The steps are as follow:
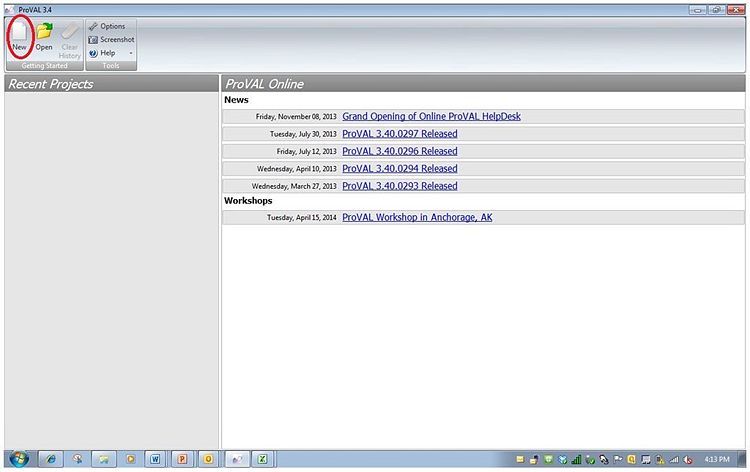
- Open ProVAL program.
- Select "New".
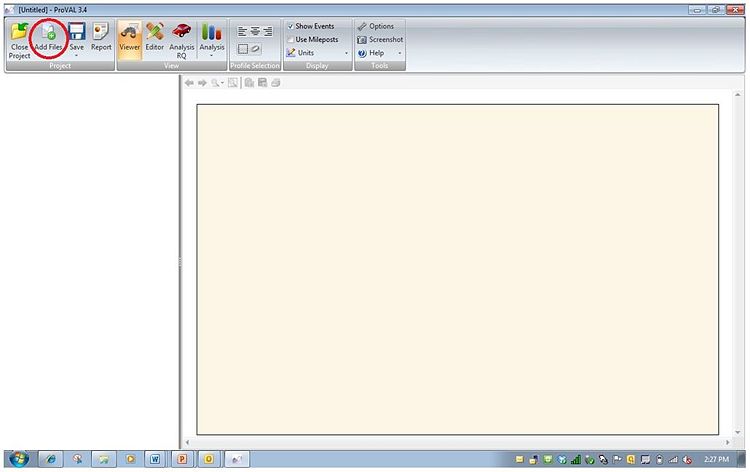
- Select "Add Files" to import PPF file with QC/QA profile data.
File(s) will contain either right and left track profiles or single wheel track profiles.
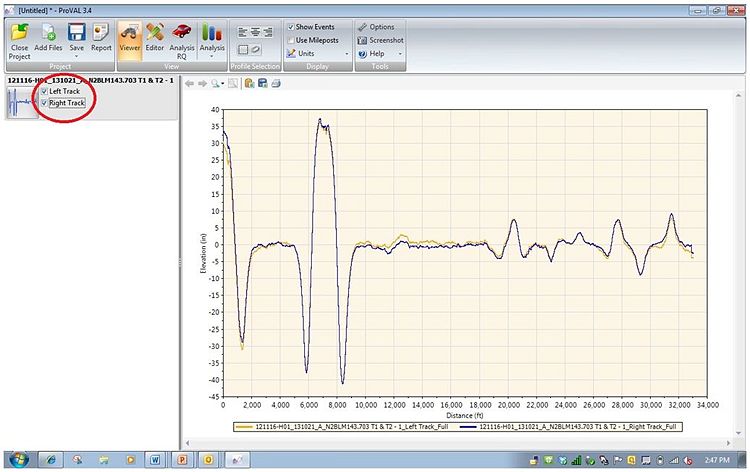
- Select left elevation and right elevation.
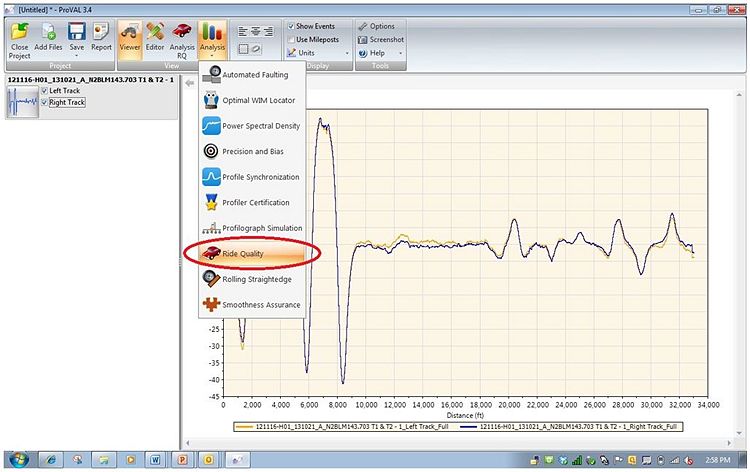
The following example uses a file containing both wheel paths. The program will correctly align files with individual wheel paths, provided the data collection was initiated at the same starting station for both files. The next screen shot shows the actual change in elevation along the profile length.
- Select "Ride Quality" in the "Analysis" module.
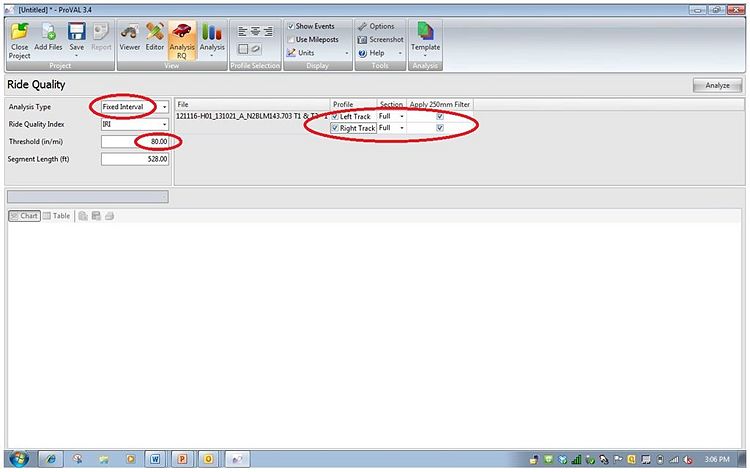
- Select "Fixed Interval" in the "Analysis Type" dropdown box.
- Change "Threshold" limit to 80 (in/mi). (Note: this threshold applies to pavement with posted speeds over 45 mph. The threshold is 125 (in/mi) for lower speed routes.) The "Segment Length" should show the default value of 528 ft. and the "Ride Quality Index" should show the default name of "IRI".
- Check box for "LElev." and "RElev." and make sure the "Apply 250mm Filter" box is checked for both.
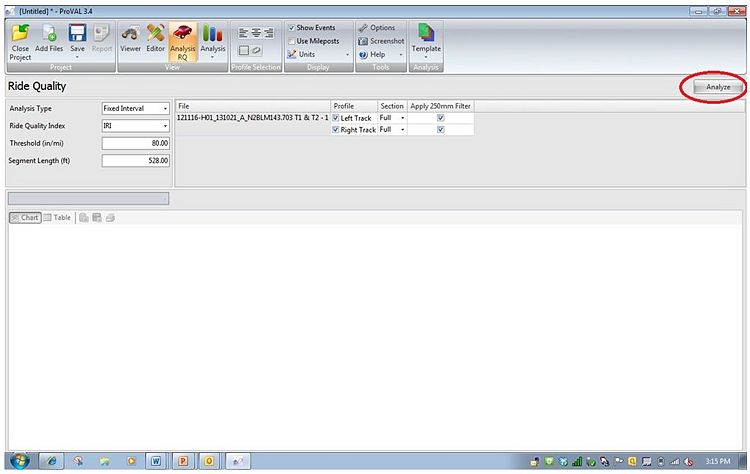
- Select "Analyze".
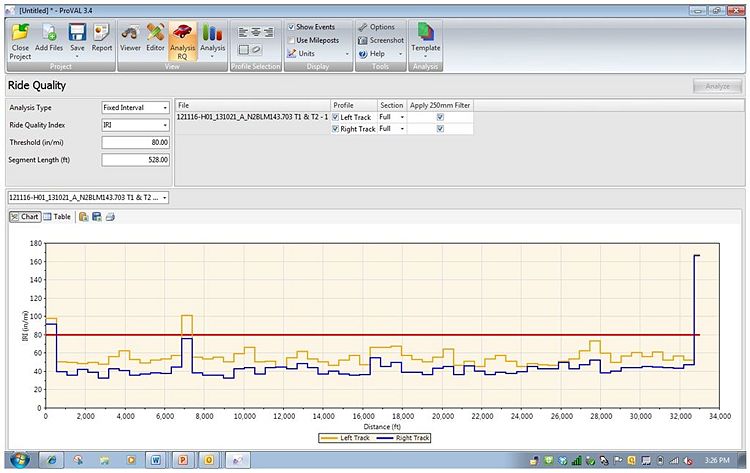
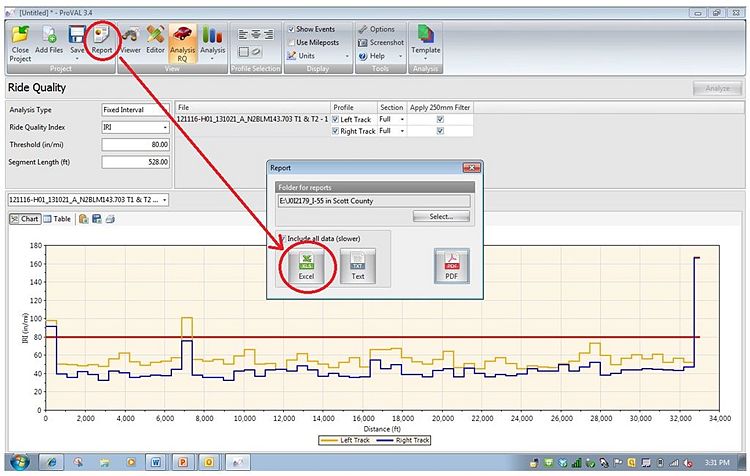
The average IRI of a wheel path for each 528 ft. long segment will be shown on the screen. The drop down menu above table at left can be used to view either left or right wheel path IRI values
- Select "Excel" in the "Report" dropdown box.
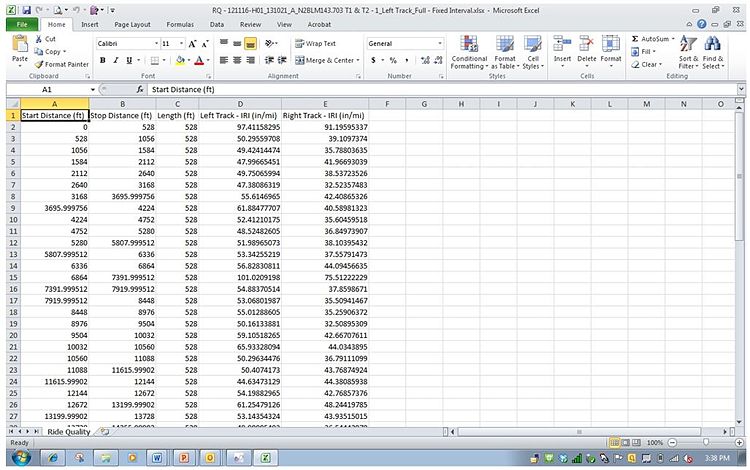
- Open the Excel file.
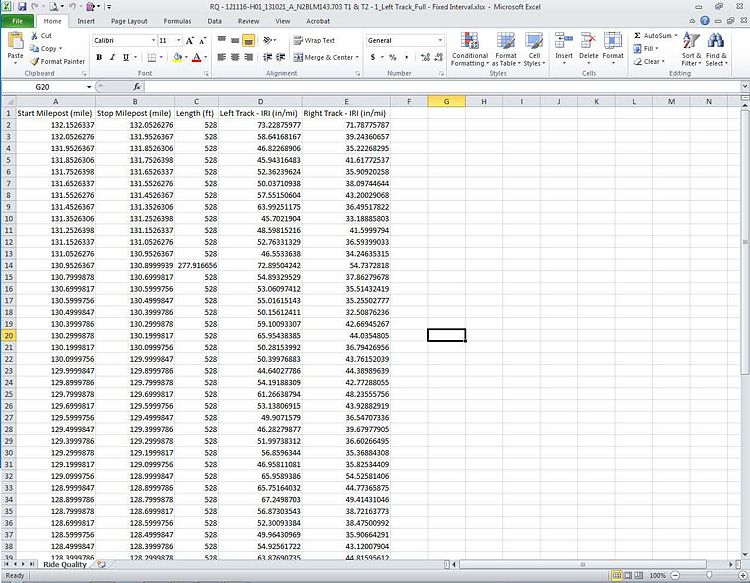
Average IRI for each segment for both wheel paths is listed in the Excel spreadsheet.
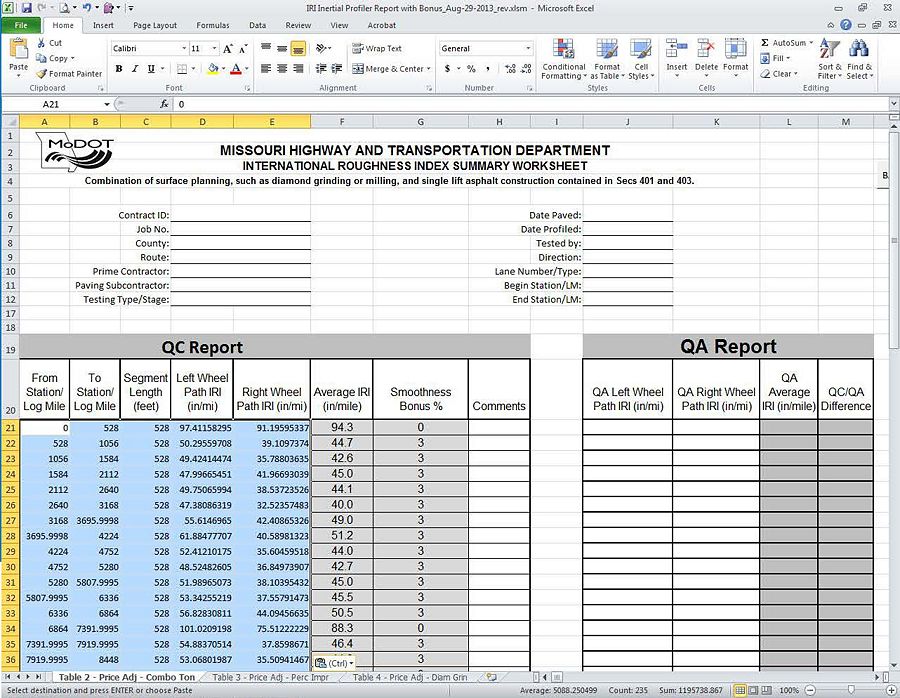
- Copy and paste this data into the "IRI Inertial Profiler Report with Bonus" Excel spreadsheet in the V:\Smoothness folder. Select the appropriate individual worksheet in the "Start" worksheet (first tab); based on posted route speed, pavement type and pay unit type. The worksheet will automatically generate pay factors for each segment.
There may be exempted areas per Sec 601.4.2.2 within the section profile limits. The engineer should verify that the limits do not go beyond the eligible exemption area. The contractor may elect to:
- 1) Stop the profile run at the beginning of the exemption and begin a new section profile at the end of the exemption.
- 2) Manually enter exemption boundaries in the data acquisition software during the profile run (typically performed with high speed IPs).
- 3) Enter a "leave-out" area in ProVAL during the ride quality analysis. The instructions for performing this are as follows:
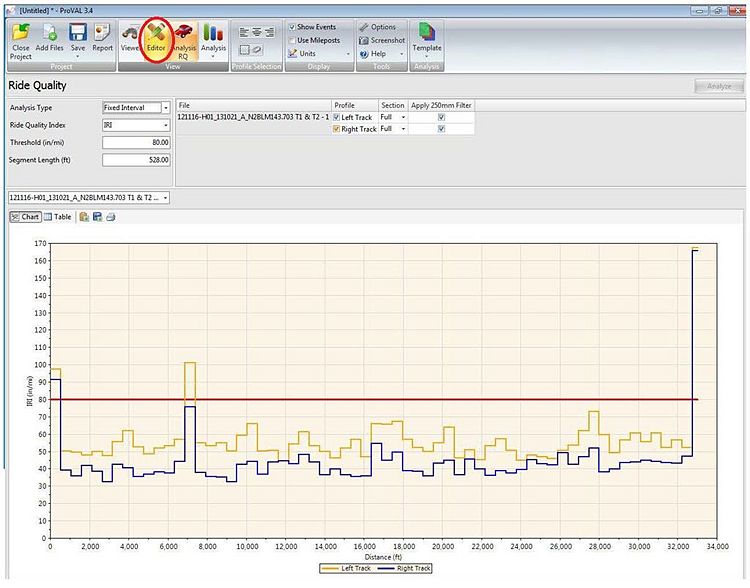
- Select "Editor". Select the file from the File dropdown menu.
- Select the IP file from the "File" dropdown box.
- Select "Sections in the "Navigate" dropdown box.
- Select "Add Section".
- Enter section(s) Start Distance, Stop Distance, Type (Leave-out) and Name.
For this example, assume there are two leave-out areas: one at the beginning where a bridge approach on the upstream side is within limits and another over a mile farther where there is another bridge.
- Select "Analysis" and select "Ride Quality".
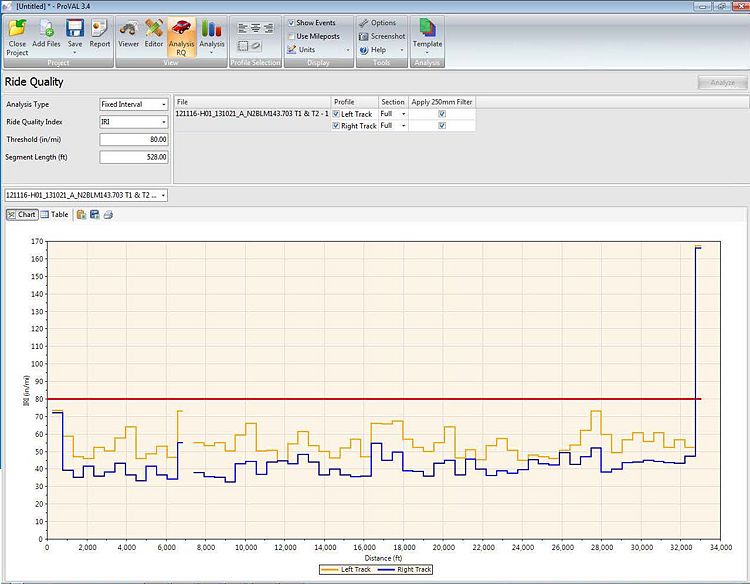
The ride quality summary shown below now excludes the exempted areas of the profile and abbreviates the associated segments accordingly.
- Select "Excel" in "Report" dropdown box.
- Open the Excel report.
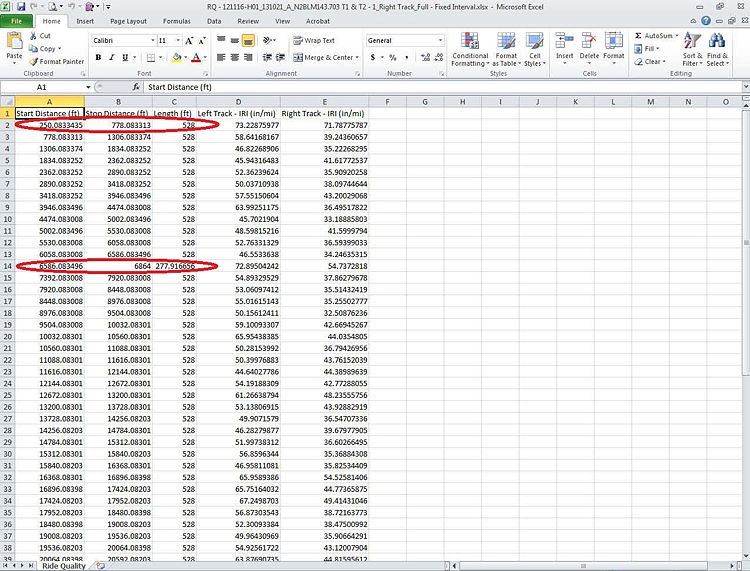
Since the first leave-out was at the beginning of the project, ProVAL has shifted the boundaries of the original segments to maintain 528-ft. lengths. However, it truncates the segment preceding the second bridge, so that it can again begin with 528-ft. lengths on the other side of the bridge. This means leave-outs should be established and analyzed in ProVAL prior to exporting the results to the "IRI Inertial Profiler Report with Bonus" Excel spreadsheet in the V:\Smoothness folder.
106.3.2.59.3.1.1 Inserting Leave-Outs
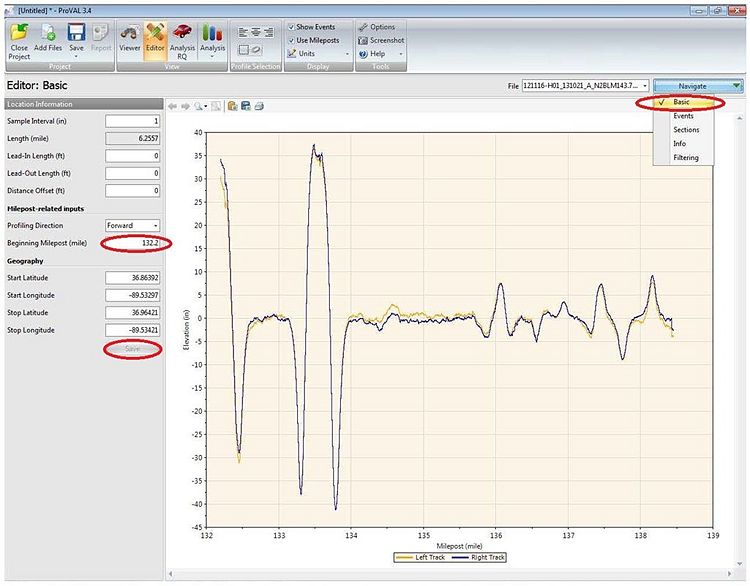
Prior to analyzing ride quality some reformatting of the stationing will probably be necessary. In this example, assume the beginning of the inertial profiler run is at log mile 132.2.
- Select "Navigate" dropdown box
- Select "Basic"
- Enter 132.2 in "Beginning Milepost (mile)" box
- Select "Save"
ProVAL has now reformatted the stations to represent actual project limits for the profile section.
106.3.2.59.3.1.2 Reversing Stations
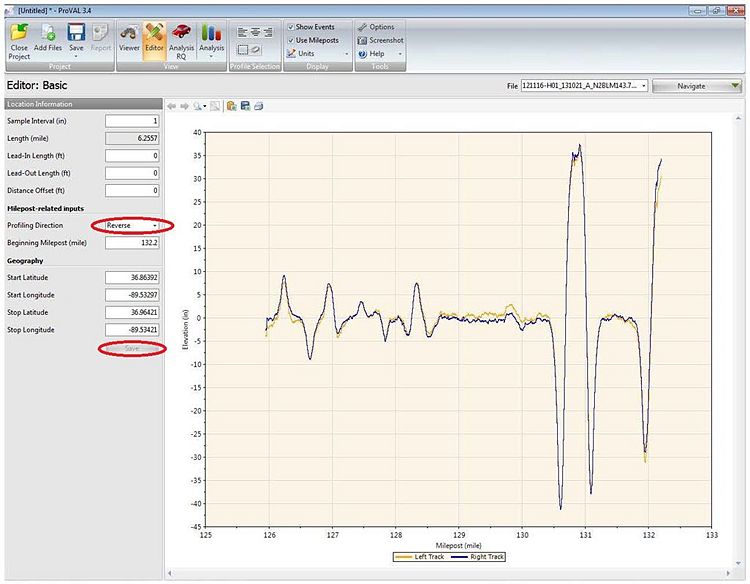
Another situation that may arise is when the direction of travel is in a station descending direction. ProVAL can also easily make this adjustment in the "Editor" mode. For this example, the starting log mile 132.2 will be retained.
- Select "Profiling Direction" dropdown box
- Select "Reverse"
- Select "Save"
Rerunning the ride analysis and creating the Excel report file will provide segment data in the reverse direction.
- Select "Analysis" and select "Ride Quality".
- Select "Excel" in "Report" dropdown box.
- Open the Excel report.
106.3.2.59.3.2 Areas of Localized Roughness
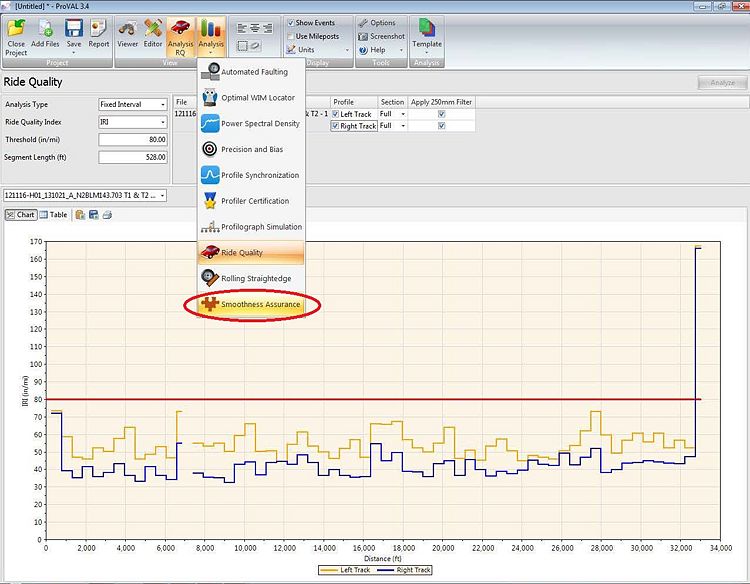
- Select "Smoothness Assurance" in "Analysis" dropdown box.
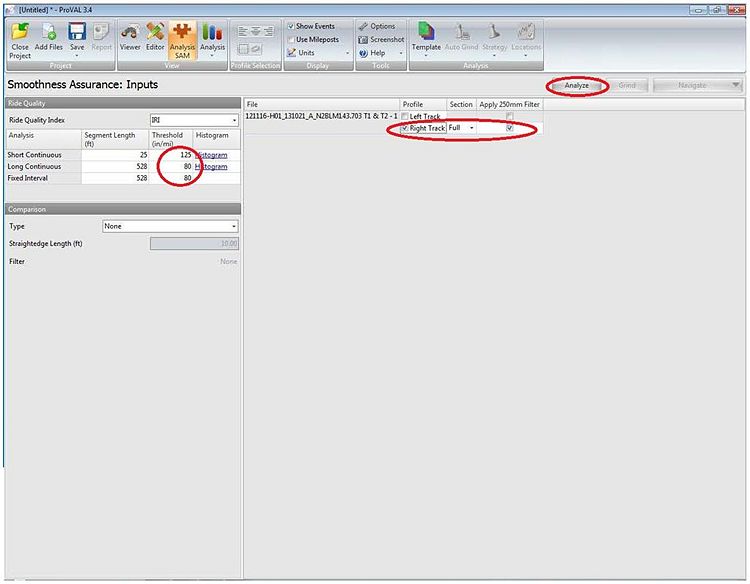
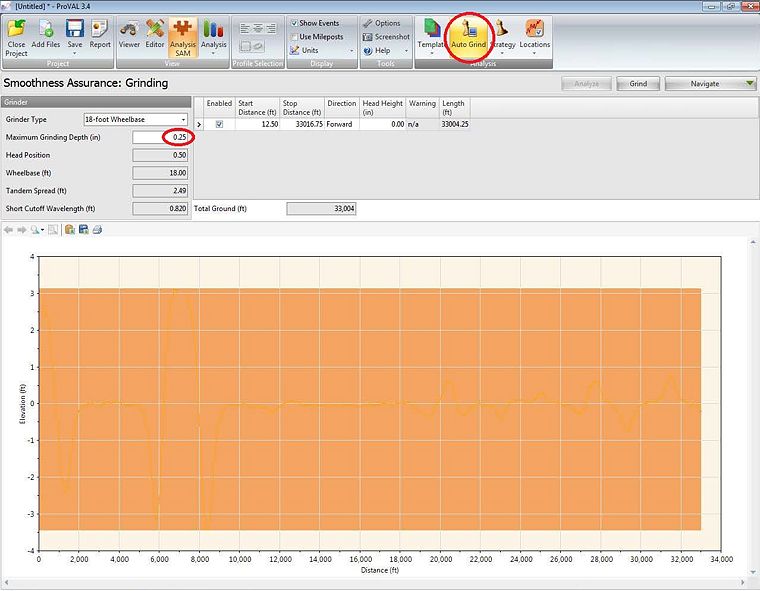
- Change "Threshold" value for "Short Continuous" analysis to 125 (in/mi) in the "Ride Quality" section. (The segment length for "Short Continuous" should be set at the default value of 25 ft.). Change "Threshold" for "Long Continuous" and "Fixed Interval" in the "Profile" section to 80 (in/mi). (The "Segment Length" for both "Long Continuous" and "Fixed Interval" should be set at the default value of 528 feet.)
- Check "Right Elevation" only in the "Profile" section (ensure "Apply 250mm Filter" is also checked).
- Select "Analyze".
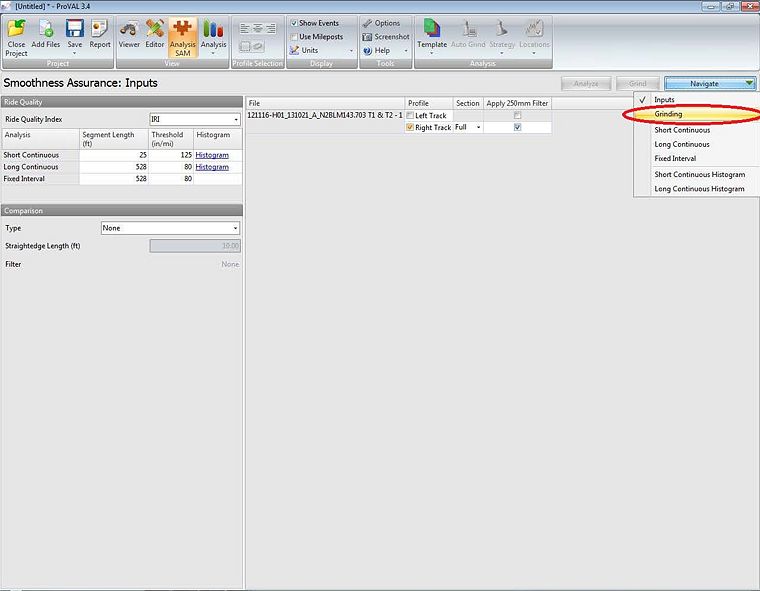
- Select "Grinding" in the "Navigate" dropdown box.
- Enter 0.25 inches for "Maximum Grinding Depth" in "Grinder" section. (The following parameters should show the default values, which are Head Position = 0.50, Wheelbase (ft) = 18.00, Tandem Spread (ft) = 2.49 and Short Cut-Off Wavelength (ft) = 0.820 ft.)
- Select "Auto Grind".
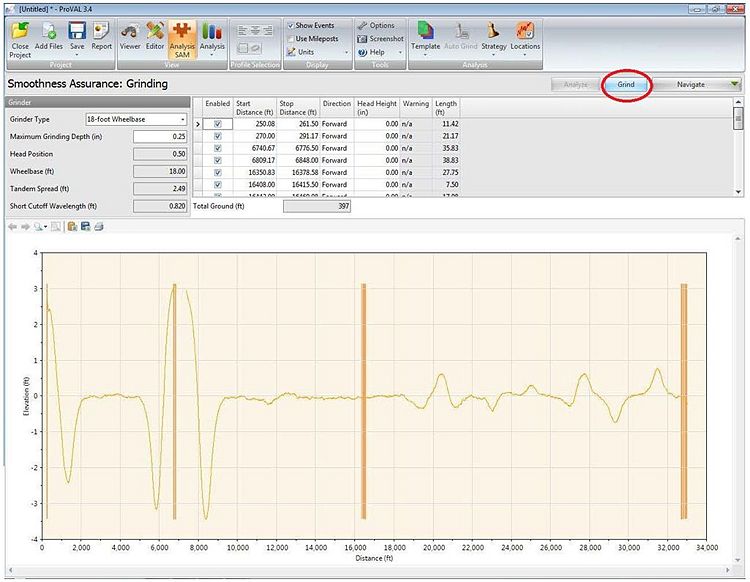
- Select "Grind".
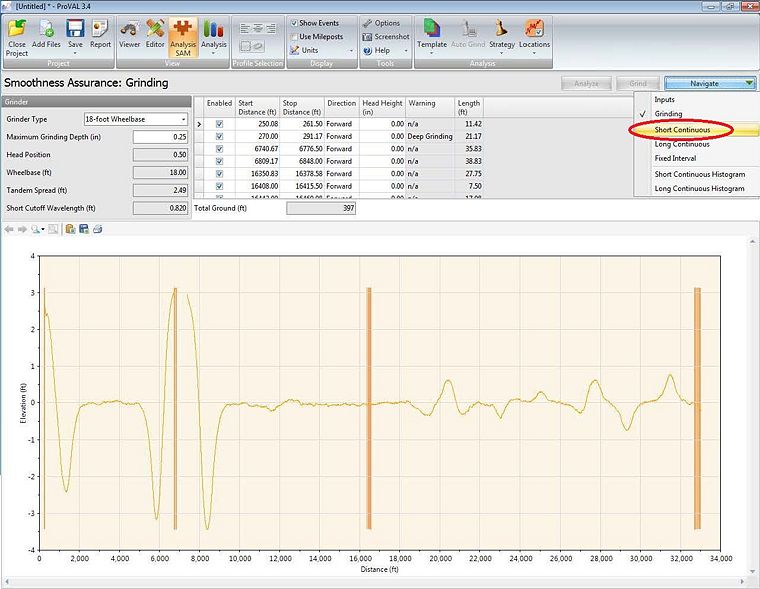
- Select "Short Continuous" in "Navigate" dropdown box.
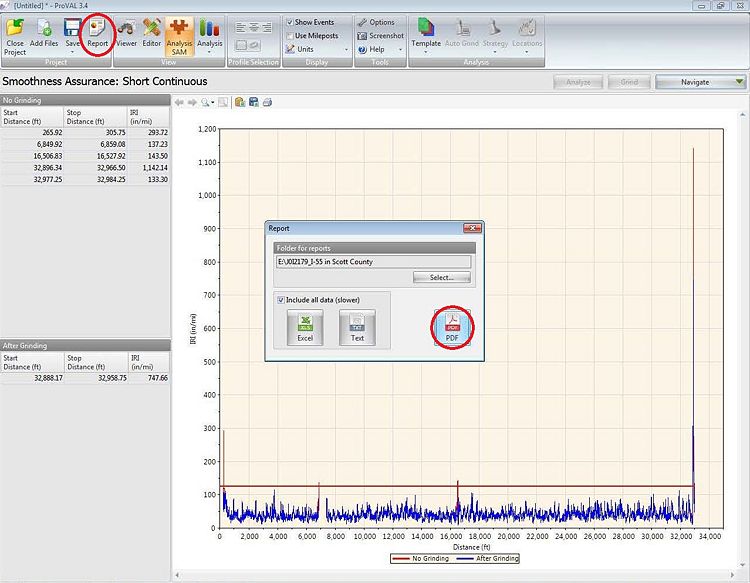
- Select "PDF" in "Report" dropdown box.
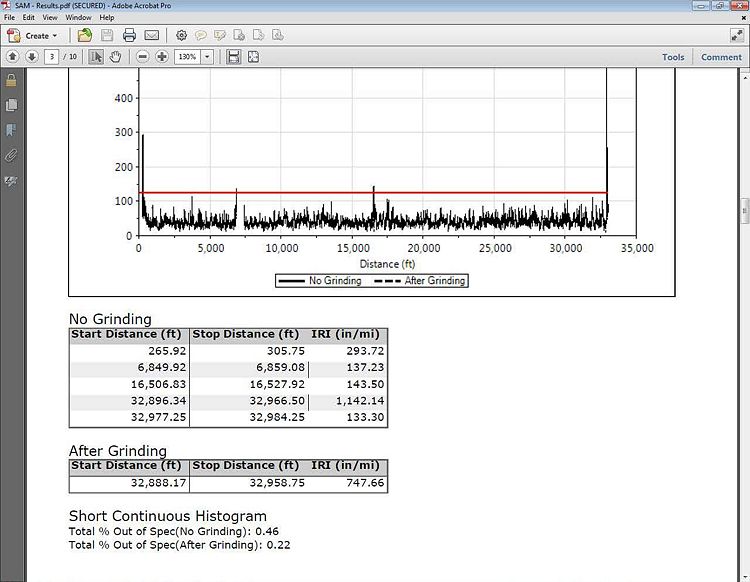
The grinding report is generated showing locations of areas of localized roughness (ALR). The grinding simulation numerically indicates what the expected improvement in smoothness should be when the ALRs are diamond ground. This information serves as a guide for both the contractor and the engineer for determining which ALRs can be corrected with conventional grinding and which may require other corrective measures.
Comparisons for IRI before and after grinding are shown in tabular and bar graph form.
106.3.2.59.4 Dispute Resolution
In the event that the QC/QA results are not within tolerance (after the absolute value of the difference between the contractor and engineer IRIs are computed for each segment within the QA test length, the average of the absolute values of the IRI difference shall be 8 in./mile or less and the absolute value of the IRI difference for any single segment shall be 12 in./mile or less), the MoDOT SurPro reference profiler shall arbitrate the dispute. The engineer shall randomly select a 528 ft. area within the disputed pavement length and run the MoDOT reference profiler in the left and right wheel paths. The arbitration profile shall be correlated with its corresponding QC and QA profiles in ProVAL. Whichever of the average QC/QA IRI profiles is closer to the arbitration IRI profile shall be the binding profile for the purpose of construction acceptance.
