106.3.2.75 TM-75, Determining Segregation Using the Nuclear Density Gauge
This test method determines segregation of bituminous mixtures with the nuclear density gauge.
Contents
106.3.2.75.1 Procedure
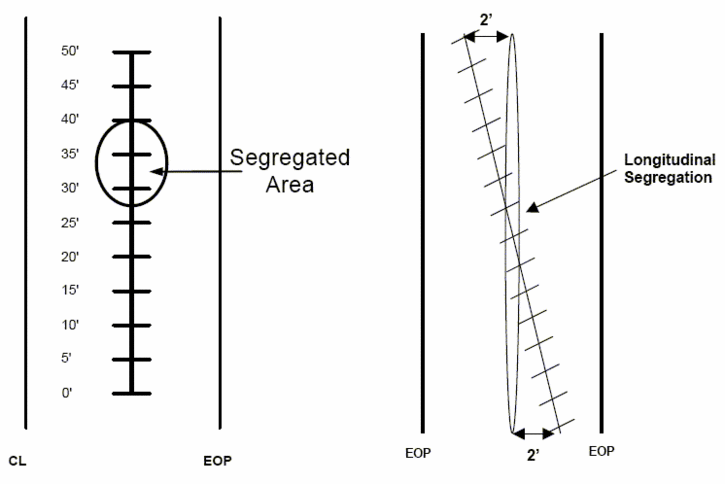
Establish a 50 ft. profile containing the suspected segregated area and take density readings every 5 ft. or a fraction thereof along a longitudinal direction. The longitudinal direction can be straight or at an angle depending on whether the segregation is across the pavement or longitudinally. When testing keep the center of the gauge at least 1 ft. from the confined joint and 2 ft. from the unconfined joint.
Using the nuclear gauge in the backscatter mode, take 2 one-minute density readings at each location and average the results. If one of the readings varies by more than 1.0 PCF from the average, take an additional reading. Average the two closest readings and check if they are within 1.0 PCF and discard the other result. The nuclear gauge should be left in the same position when multiple readings are taken. The nuclear gauge does not need to be calibrated to the mix.
Take readings at a minimum of 11 locations along the profile section.
106.3.2.75.2 Calculations
From the data retrieved in the procedure, determine the highest density reading, the lowest density reading, the average profile density, the drop in density and the maximum density range.
Drop in density is the average profile density minus the lowest density.
Maximum density range is the highest density minus the lowest density.
106.3.2.75.3 Criteria
When a profile section is taken, both values are evaluated independently and addressed accordingly.
| Not Segregated | Action Taken | Remove and Replace | |
|---|---|---|---|
| Max. Density Range | < 7.0 | = or > 7.0 & < 9.0 | = or > 9.0 |
| Drop Density | < 3.5 | = or > 3.5 & < 4.5 | = or > 4.5 |
If a value falls in the “Action Taken” column, then segregation is evident and immediate action shall be taken by the contractor to resolve the issue; however, the severity of the segregation does not warrant removal and replacement. It is not the intent that production will continue day after day when results are in the “Action Taken” range.
106.3.2.75.4 Example
Identify area of concern and establish a 50 ft. profile through this region.
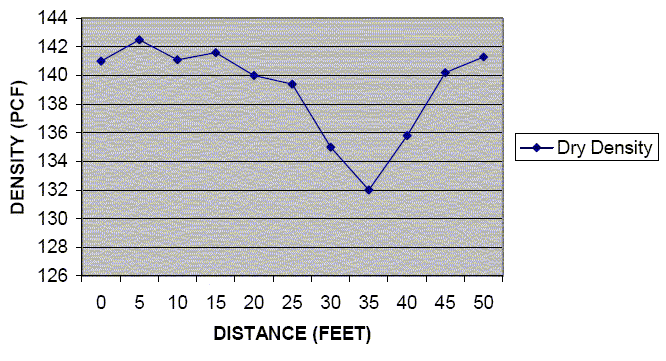
Take two density readings at each spot and average the results. If one of the readings is not within 1.0 PCF of the average, take an additional reading. Average the two closest readings and check if they are within 1.0 PCF and discard the other result. Record the data and average the results for each location, as shown in the table below.
| Distance (ft.) | Readings (PCF) | Average (PCF) |
|---|---|---|
| 0 | 140.8 & 141.1 | 141.0 |
| 5 | 142.1 & 142.9 | 142.5 |
| 10 | 140.2 & 141.9 | 141.1 |
| 15 | 140.6 & 142.6 | 141.6 |
| 20 | 140.2 & 139.7 | 140.0 |
| 25 | 139.1 & 139.7 | 139.4 |
| 30 | 135.1 & 134.9 | 135.0 |
| 35 | 132.3 &131.7 | 132.0 |
| 40 | 136.4 & 135.2 | 135.8 |
| 451 | ||
| 50 | 141.7 & 140.9 | 141.3 |
| 1 At 45 ft. the first two readings had more than a 1.0 PCF difference from their average of 139.0. Another reading was taken and in this particular case the first value was discarded and a new average was determined. | ||
If desired, plot the density verses distance to give a graphical presentation of the area in question.
From the average density results pick out the highest and lowest results and compute the average density, as shown in the table below.
| Field Data | Density (PCF) |
|---|---|
| Highest Density | 142.5 |
| Average Density | 139.1 |
| Lowest Density | 132.0 |
Compute the maximum density drop and the maximum density range and check for compliance.
The maximum density drop is the average density minus the lowest density:
- 139.1 – 132.0 = 7.1
The maximum density range is the highest density minus the lowest density:
- 142.5 – 132.0 = 10.5
The area in question requires removal and replacement according to the values obtained. It only takes one of the two criteria to fail before action must be taken.
106.3.2.75.5 Precautions
The nuclear density gauge is designed for high surface temperatures; however, the temperature inside the gauge is not to exceed 160° F. If the nuclear gauge is being used before the asphalt pavement has had a chance to cool down, remove the gauge from the surface immediately after the readings have been taken. If the temperature inside the gauge exceeds the 160° F, the nuclear gauge can experience temporary malfunction or permanent damage.

